Life and Breath Metro 2022
Health impacts of air pollution
Life and Breath: Metro (updated 2022)
Life and Breath: Twin Cities Metro (updated 2022) (PDF)
Air pollution is a public health issue

Breathing polluted air creates or worsens numerous health conditions and can lead to early death. Although air quality in Minnesota meets current federal standards, environmental conditions are changing. For example, Minnesotans are experiencing a steady increase in seasonal smoke exposure from wildfires, triggering air quality alerts and heightening concerns about the health impacts of smoke and other air pollutants.
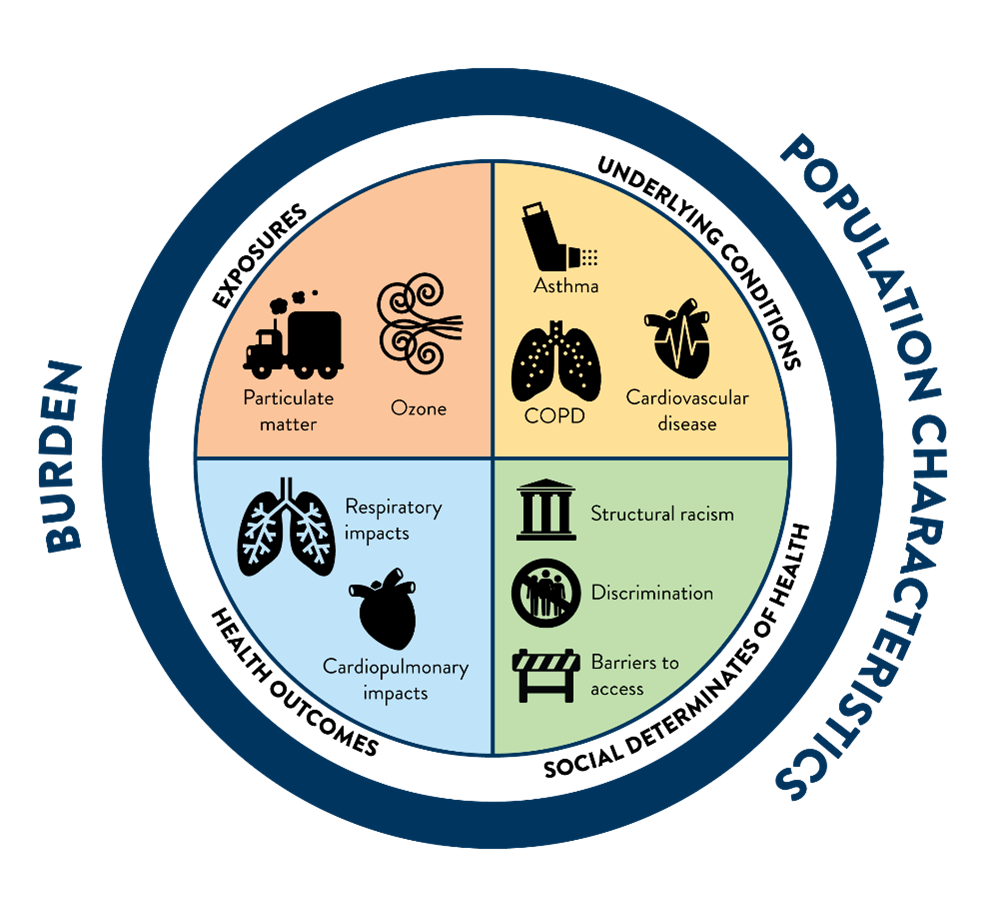
While all Minnesotans are susceptible to the health impacts of air pollution, these impacts do not affect all Minnesotans equally. Structural inequities formed through institutional systems like city planning, infrastructure, and policies have led to disparities in local source pollution. People living near high-traffic roads and heavy industry often have more exposure to air pollution than those who live, work, and gather in less-polluted areas. This unequal air pollution burden, together with higher underlying rates of lung, heart, and other health conditions among communities with more pollution exposure, can lead to disparate health outcomes.
The Minnesota Department of Health (MDH) and the Minnesota Pollution Control Agency (MPCA) work together on the intersection of air and health. We have estimated annual health impacts of air pollution by ZIP code across the seven-county Minneapolis-St. Paul (Twin Cities) metro area which includes 166 zip codes.
Twin Cities residents experienced overall annual improvements in air quality with local health impacts
Between 2008 and 2015, fine particles (PM2.5) pollution improved by 30% and ozone pollution improved by nearly 10% throughout the metro area. We know, however, that even low to moderate levels of air pollution can adversely affect health, especially and more for people who already have lung and heart conditions.
Table 1: Estimated deaths attributable to air pollution in the seven-county Twin Cities metro area.
| Health outcome | Pollutant | Year | Deaths* | Percent of deaths* | Attributable rate** | Deaths preventable with air quality improvements*** |
|---|---|---|---|---|---|---|
| All cause deaths (25 and older) | PM2.5 | 2008 | 2,152 | 12.6% | 110.5 | 247 |
| 2015 | 1,588 | 8.6% | 74.9 | 185 | ||
| Cardiopulmonary deaths (all ages) | Ozone | 2008 | 23 | 1.1% | 0.8 | 7 |
| 2015 | 19 | 0.8% | 0.6 | 7 |
*Attributable to PM2.5 and ozone **per 100,000 people ***reduction of 10% for PM2.5 and ozone
Air pollution played a role in an estimated 10% of all deaths — about 1,600 — in the Twin Cities metro area in 2015
Figure 1: PM2.5 attributable (and underlying) all-cause death rates (ages 25 and older) in the Twin Cities metro area for 2015 by zip code
Death rate by ZIP, ages 25 years and older: fine particles
Figure 2: Ozone-attributable (and underlying) cardiopulmonary death rates (all ages) in the Twin Cities metro area for 2015 by zip code
Death rate by ZIP, all ages: Ozone
Nearly 500 hospitalizations and emergency room (ER) visits for heart and lung problems were related to PM2.5 and ozone pollution in 2015
Ambient PM2.5 and ozone are two of many air pollutants that impact health, therefore these estimates for hospitalizations and ER visits are likely an underestimate of the total air pollution health burden.
Table 2: Estimated hospitalizations attributable to PM2.5 in the seven-county Twin Cities metro area in 2015
| Health outcome | Age group | Attributable # of events | Percent of total events | Attributable rate per 100,000 |
|---|---|---|---|---|
| Asthma hospitalizations | Under 18 | 7.4 | 1.4% | 1.0 |
| Respiratory hospitalizations | 65 and older | 113 | 1.4% | 28.3 |
| Cardiovascular hospitalizations | 65 and older | 60 | 0.5% | 15.0 |
| Asthma ED visits | All ages | 215 | 2.0% | 6.8 |
Disproportionate impacts across metro communities persist
The highest estimated rates of air pollution-related death and disease are found in neighborhoods with the largest percentage of Black, Indigenous and People of Color (BIPOC), low-income and uninsured residents, and people who live with a disability.
Figure 3: Twin Cities zip codes 2015: non-fatal impacts from PM2.5 by poverty, BIPOC residents uninsurance status, and any disability
What is being done about air pollution and its health impacts?
These study results,by the Minnesota Department of Health (MDH) and Minnesota Pollution Control Agency (MPCA) and meaningful stakeholder engagement will help us direct pollution reduction resources. This can help address environmental justice and health equity goals, including inequities like of air pollution exposure and access to health care. Recent progress includes MPCA grants through the Volkswagen Settlement and MDH programs like the Eliminating Health Disparities Initiative.”
MDH and MPCA work together on the intersection of air and health. This study is the result of a collaboration between MDH and MPCA. See the Life and Breath: Metro (updated 2022) (PDF) here or learn more from MPCA.
Health and environmental justice data tools
- CDC’s Environmental Justice Dashboard
- CDC's Environmental Public Health Tracking
- CDC's Heat and Health Tracker
- CDC's Social Vulnerability Index
- MPCA’s Understanding Environmental Justice in Minnesota interactive map
Related links
- See current conditions and sign up for air quality alerts.
- Air quality
- Asthma
- Heart Disease
Publication date: September 2023.